Green vs pink hydrogen production in Japan: a partial circular economy approach (Part 4/6)

· 18 min read
This article is the fourth in a series of six, based on a research by Dr. Venera N. Anderson, “Comparative Analysis of Green and Pink Hydrogen Production in Japan Based on a Partial Circular Economy Approach”. You can read part one, two and three here.
Japan is currently facing urgent energy and environmental challenges, demanding bold and sustainable solutions. As the world’s fifth-largest carbon emitter, the country must rapidly transition to cleaner energy sources to meet its 2050 carbon neutrality goal. Recognizing hydrogen’s potential, Japan has committed to major investments, including the $400 million Japan Hydrogen Fund and extensive government-backed incentives. However, while hydrogen is often seen as a “clean” energy source, its production and supply chains still carry emissions and environmental trade-offs. Identifying the most reasonable, practical, and economic source of clean hydrogen (green or pink) beyond 2040 is therefore critical. This research examines Japan’s energy and environmental situation, exploring how hydrogen, produced using a partial circular economy approach, could become the future cornerstone of Japan’s energy strategy.
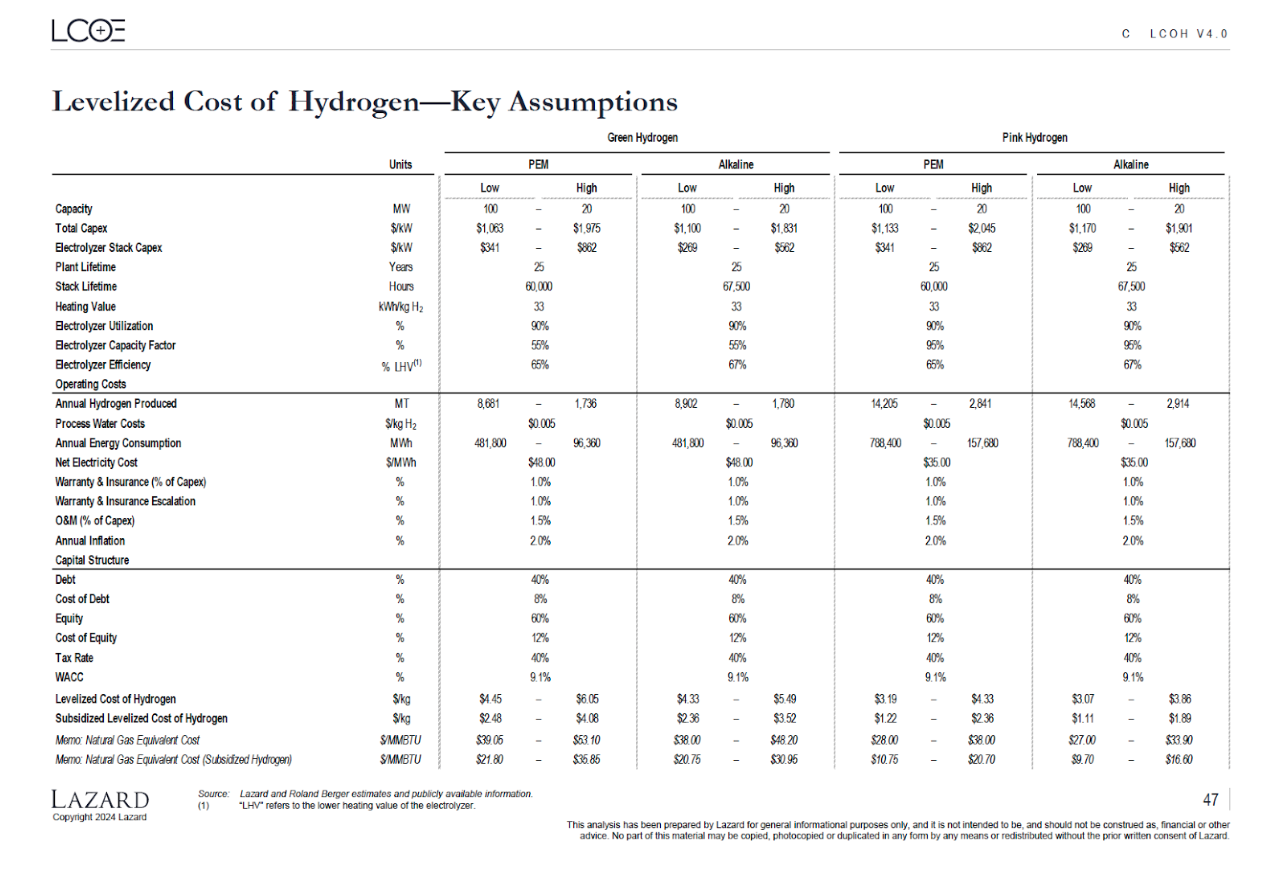
Strategic Energy Plan (METI, 2021) described the plans to lessen the clean H2’s supply cost from 100 yen/Nm3 to 30 yen/Nm3 in 2030 and no more than 20 yen/Nm3 in 2050. The government based the target price of 30 yen/Nm3 on the target import price of gray H2, adding import-related costs, such as conversion and transportation to clean H2 carriers for storage and transport (REI, 2022; AHC, 2020). Moreover, the levelized cost of hydrogen (LCOH), the critical industry economic metric for H2 production, was the “ratio of the total costs of generic/illustrative plant to the total amount H2 expected to be produced over the plant’s lifetime” (Gomonov et al., 2023, p. 6). LCOH did not account for pre-development and de-commissioning expenses or costs of delivery, storage, and end-use adaptation (Gomonov et al., 2023). The LCOH, provided by Lazard LCOE+ (2024), also did not incorporate costs for electric grid upgrades, existing infrastructure upgrades, or potential environmental or social externalities. Table 1 (Appendix) shared Lazard LCOH for green and pink H2 production for PEM/Alkaline electrolyzers in the USA, FTI (2024) 2030 global green H2 (landed cost) projections, Statista (2024e) 2030 landed costs projects from Australia, IAEA (2024) pink H2 costs, publicly available LCOH’s costs for Japan’s green and pink H2 production, and LCOH for green H2 project (Endo, 2024). Since such a mixture of global and Japan’s limited quantitative information did not offer a solid basis for an economic comparative analysis of Japan’s green and pink H2 production based on a partial CE approach, the author chose other proxy criteria for the analysis.
CHP (2024a) stressed the significance of OPEX in evaluation of clean H2 technology investments. Most studies indicated that the economic viability of clean H2 production depended on country-specific factors influenced by energy cost, capacity factors, and CAPEX (Gononov et al., 2023). A capacity factor measures how often an electricity-generating unit operates compared to its total potential over time. Nuclear energy usually has the highest capacity factor of any other energy source while producing carbon-free and reliable power. For example, in 2023, the Japanese nuclear energy capacity factor was 28.0 % (9.3 points higher than in 2022) (Takehara, 2024). This was still a far cry from the METI plans in 2010, which aimed to achieve a 90% capacity factor across all plants (WNA, 2024). In comparison, in 2022, the US nuclear generation achieved a capacity factor of 92.6%, versus 36.1% (wind) and 24.1% (solar PV) (Cleveland & Ni, 2024). Noting the importance of the differences between the costs of electricity and capacity factors, Lazard's (2024) key LCOH assumptions (Figure 11) highlighted the main differences related to net electricity/cost electrolyzer capacity factors in the US: US$48/55% (green H2) and US$35/95% (pink H2).
Therefore, the study's economic criteria focused on three categories:1) selected OPEX (operating expenses), including costs of electricity/heat with associated capacity factors, and that of water consumption; 2) CAPEX (capital expenditures), including CAPEX for hubs/WWTP and the cost of electrolyzers; and 3) subsidies (Table 2, Appendix). Also, the study relied on the electricity data provided by the government and other sources while recognizing that the Levelized Full System of Electricity (LFSCOE) would be a better metric for the cost comparison between various generation sources. The LFSCOE was much higher for renewables (wind and solar) due to the more significant requirement for storage to overcome solar and wind intermittency (Idel, 2022).
Figure 11
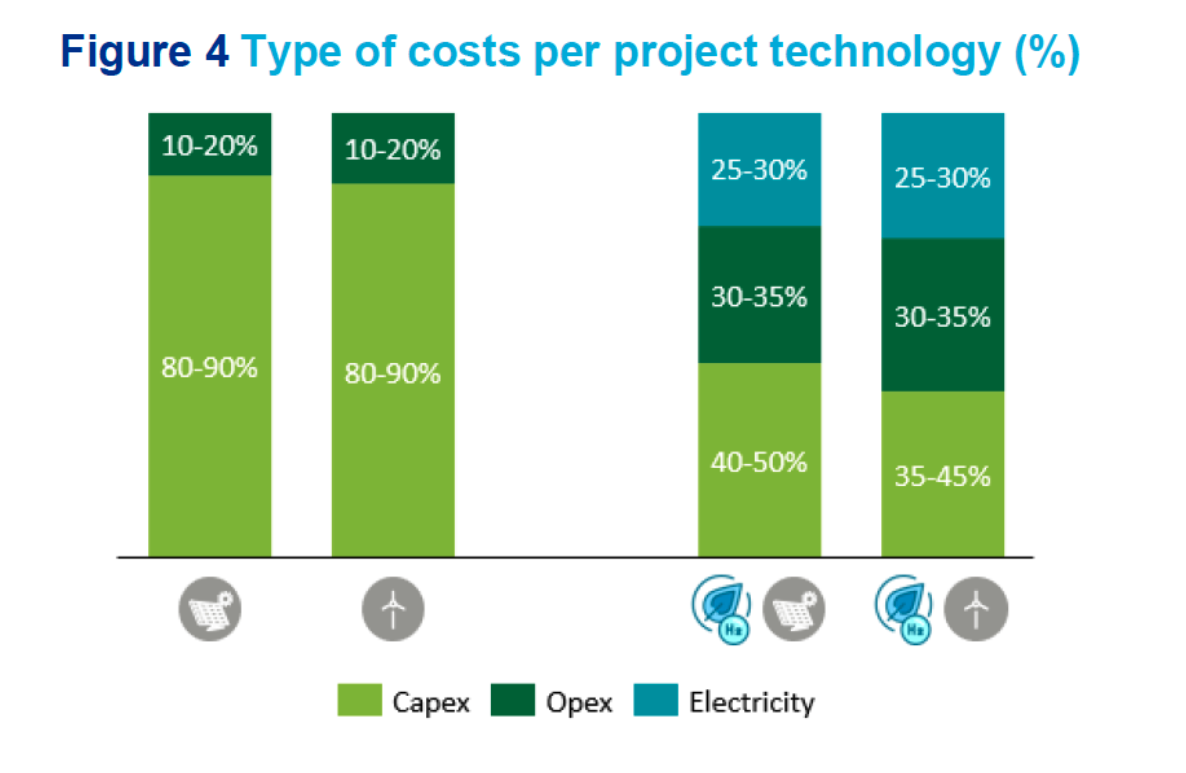
The fixed and variable operating expenses (OPEX) are significant for green and pink H2 hubs based on a partial CE approach. Such costs consist of electricity/heat costs needed for electrolysis, the cost of purified water, labor/administration/customer support costs, and costs for the hubs’ operations and maintenance (O&M) (Herco, 2024). The 2024 summary report by Clean Hydrogen Partnership (CHP, 2024) identified OPEX as the primary cost ingredient in dual-energy installations (electrolyzer and onshore wind/solar). Figure 12 shows that OPEX (assuming the electricity sourcing as an OPEX) for dual energy installations is the most significant cost factor in the cost of green H2 production accounting for nearly 50-65% of total costs.
Figure 12
Due to lack of information about specific labor, administration, customer support, and additional O&M costs related to future Japanese green and pink H2 hubs based on a partial CE approach.
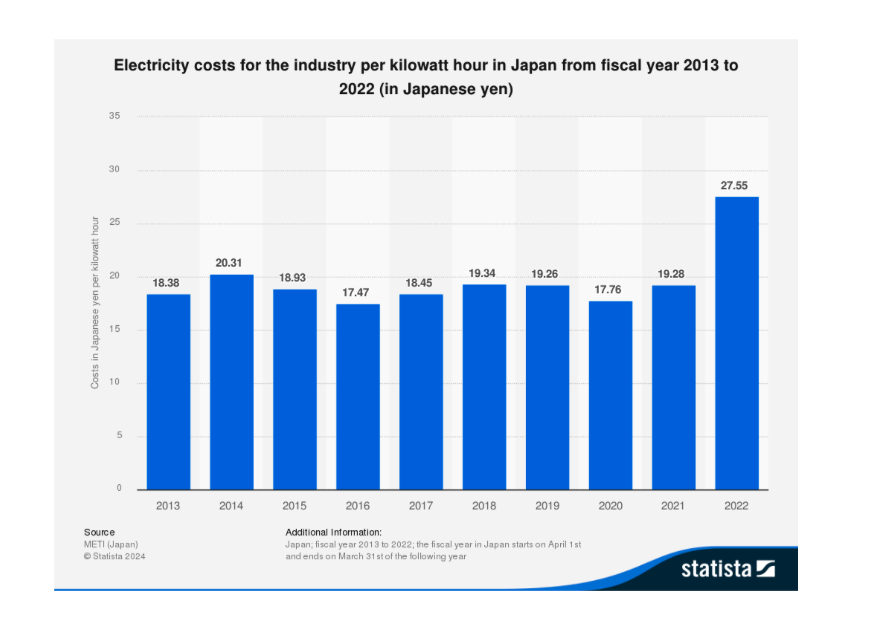
First, as shown in Table 2 (Appendix), electricity/heat cost with associated capacity factors was the study’s first criterion within the OPEX. Japan had a drastic increase in electricity costs for industry from 2013 to 2022 (Statista, 2024d), as shown in Figure 13.
Figure 13
Projecting Japan’s electricity/heat costs with associated capacity factors in the future (2040-beyond) is impossible with all the technological, domestic, and global changes that might happen between December 2024 and the future. For the sake of this analysis, the only future projected numbers that were available in the public domain were used from the METI (2021b, 2021c), which provided the ranges for the cost of electricity estimates (system costs) for each generation costs for 2030 (Figure 14).
Figure 14
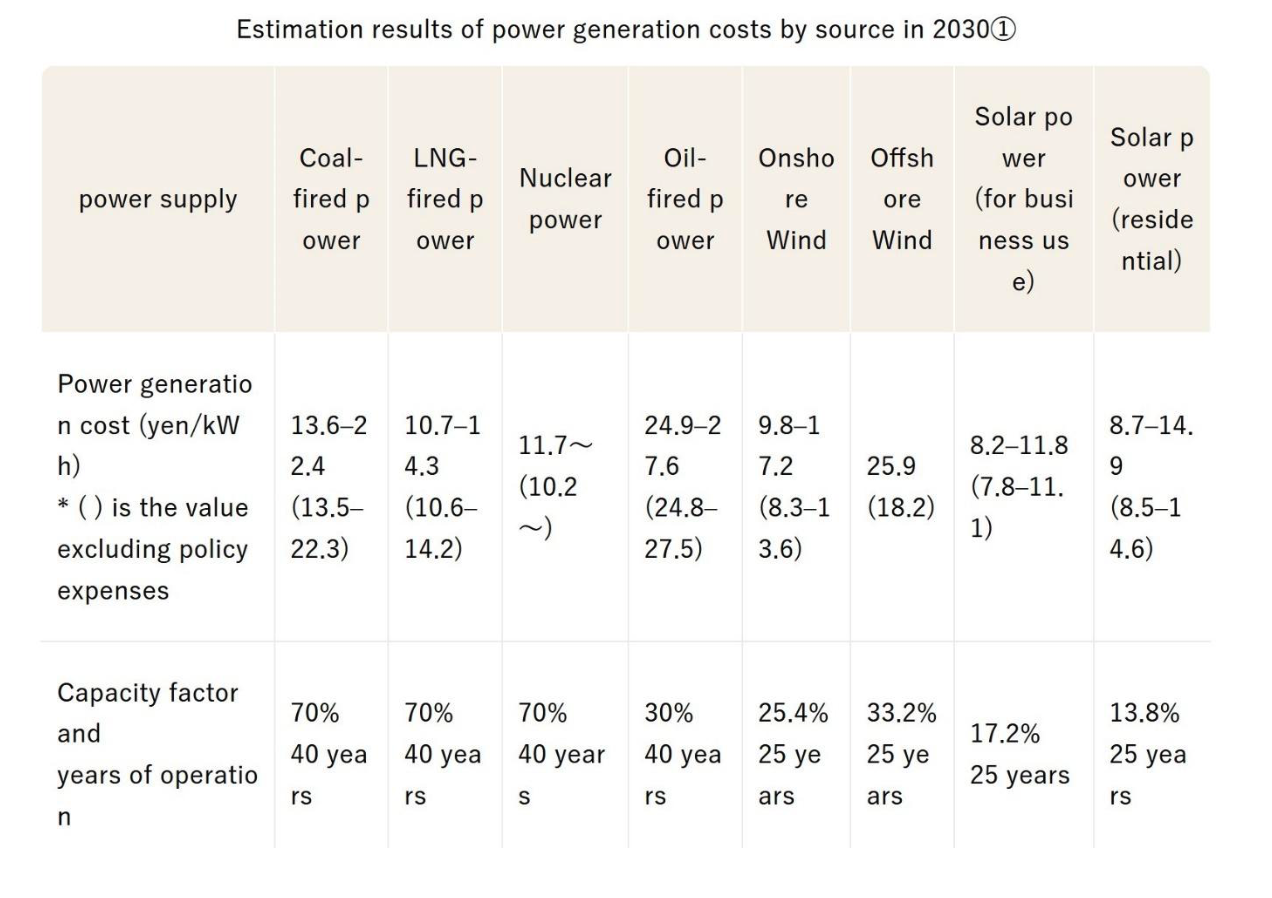
The total costs included capital costs, OPEX (labor and repair), fuel costs, social costs, and policy costs related to the subsidies for electricity generation sources. The percentage of the projected 2030 OPEX was as follows per selected power generation sources: 1) nuclear (32.7%); 2) onshore wind (23.6%); 3) offshore wind (28.57%); and 4) solar power (for business use) (24.8%) (METI, 2021c). The 2030 costs were based on the future fuel costs released by global organizations and specific costs associated with Japanese facilities, their capacity factors, and the installed amount of solar generation. Thus, these future results, especially those projected past 2030, would change if the assumed values change (METI, 2021c). As far as heat, nuclear power plants generate significant amounts of heat as a by-product of the nuclear fission process. Using the heat for pink H2 could improve system efficiency by utilizing thermal energy that would otherwise be wasted (Fernandez–Arias et al., 2024). Heat reuse fits well with the analysis methodology, especially with the “reuse” stage of the Ellen MacArthur Foundation (2024)’s technical cycle of the CE system diagram (Figure 1).
In this sub-section about the OPEX for green and pink H2 hubs based on the partial CE approach, like METI (2021c) and CHP (2024b), the study assumed that CAPEX related to the energy generation source was a part of the electricity costs. FTI (2024) claimed that the CAPEX of the electricity cost could significantly affect the LCOH of green H2 production. For example, considerable reductions in the CAPEX component in both LCOE (levelized price of electricity) and LCOH could be observed in locations with significant renewable resources (like Chile or Australia). Bloomberg News (2024a) described Fortescue’s views on Japan, which considered it unattractive as a current center of green H2 production due to high renewable energy electricity costs. Japan would need to pursue further ways to lower its renewable energy power costs to lower the LCOH for green H2 (REI, 2022). The country also must invest in developing new wind and solar plants, transmission infrastructure, and battery storage (Shiraishi et al., 2023) towards building its green H2 hubs, which might increase the CAPEX costs for electricity from renewable sources.
Regarding pink H2, Japan also could consider restarting its existing nuclear reactors and invest in advanced ones, such as small-modular reactors (SMRs). For instance, currently, there were 33 operable reactors, with 13 restarted, 12 waiting for restart approval, and 27 slated for decommissioning. The reactor restarts would incur substantial implementation costs ($700 million to $1 billion/unit), regardless of reactor age or size (WNA, 2024). Nuclear energy’s CAPEX might be reduced by introducing advanced nuclear reactors, such as SMRs (IAEA, 2023). Recently, Japan intended to promote the replacement of decommissioned nuclear reactors with next-generation reactors (Japan NRG, 2024d). However, the uncertain domestic political situation might impact such intentions. Lastly, last year Japan’s Diet enacted a bill that allowed nuclear reactors to remain in power beyond the present sixty-year limit (NHK, 2023). Thus, extending the life of all reactors, reusing once operating nuclear reactors, and returning them to good working order, relate to “maintain/prolong,” “reuse,” and “refurbish” stages of the technical cycle of the Ellen MacArthur Foundation’s CE system diagram (Figure 1).
The cost of purified wastewater was the study's second criterion within the OPEX. Water reuse helps save water resources, lessen environmental impacts, and reduce the costs and energy of water resource management. Water reuse fits well with the analysis methodology, especially with the “reuse” stage of the technical cycle of the CE system diagram of the Ellen MacArthur Foundation (2024) (Figure 1). As part of the CE approach, Japanese water reuse history started in the 1980s as a response to severe droughts and increased water demand due to Japan's economic growth and rapid urbanization. Although water reuse has been developed since the 1980s, the utilization of wastewater in Japan remained limited. In 2016, besides being allocated for existing WWTPs, the amount of reclaimed water was 210 million m3/year, only 1.3% of the total amount of wastewater produced (14.7 billion m3/year). Figure 15 illustrates the usual Japanese reclaimed water application.
Figure 15
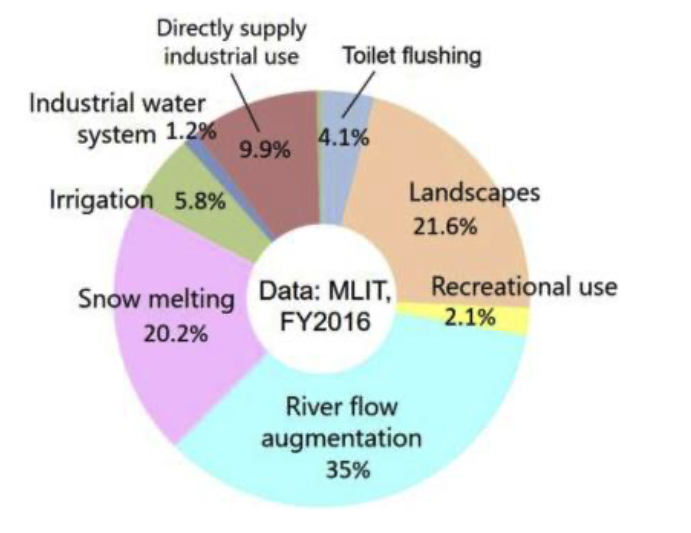
Reclaimed water utilization in Japan was limited due to the high energy consumption of water reclamation facilities and inadequate quality standards for recycled water (GOJ, 2021; Takeuchi & Tanaka, 2020; JICA (n.d.)). Due to the Japanese water scarcity issue, as mentioned in the Introduction, the study assumed that using something other than the internal surface, groundwater, flood, and precipitation water in the green or pink H2 production would be prudent. Instead, Japan might need available water resources for its water, food, and economic security in the context of sustainable development.
Furthermore, desalination could be a potential bridge solution for water production for Japan's green and pink H2 hubs, especially if new technologies make desalination more efficient (Chandler, 2019). However, the backlash against a proposed US green H2 hub in Texas against desalination due to the negative brine effect on the surrounding marine environment (Volcovici, 2024) necessitated seeking other water solutions in Japan based on the partial CE approach.
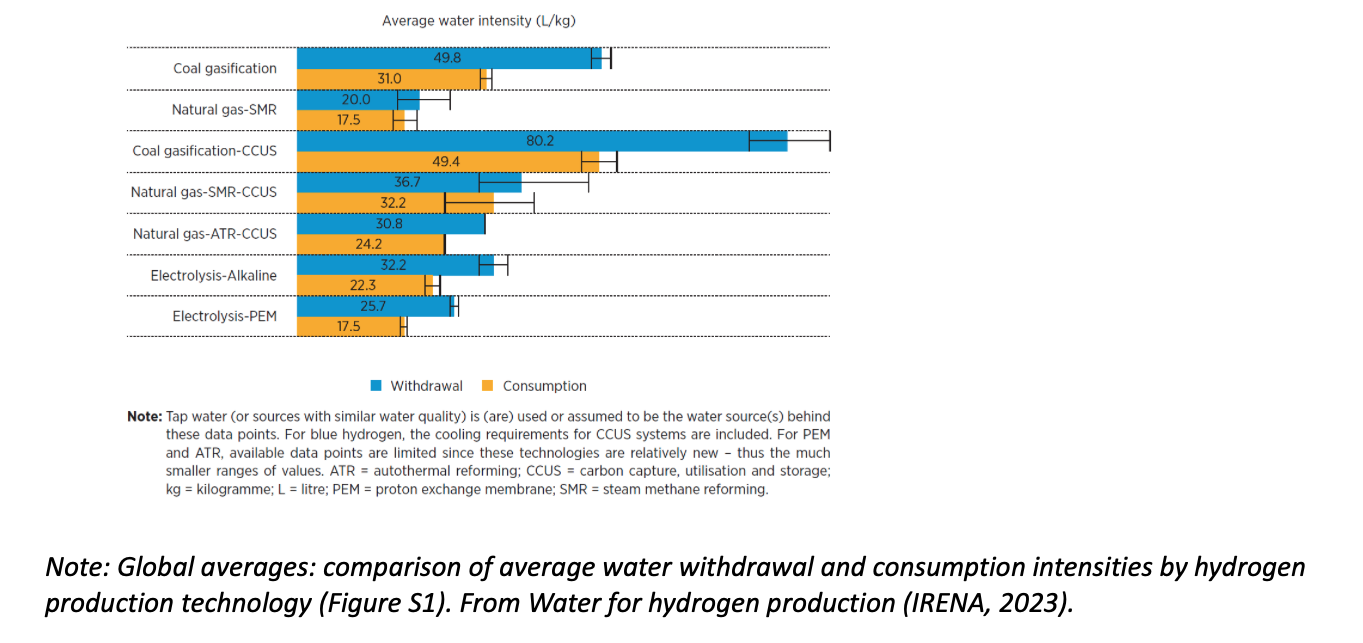
Desalination facilities usually dispose of the brine in seas and oceans. Brine can be a source of useful products (sodium hydroxide and hydrochloric acid) (Chandler, 2019). However, it adversely affects the surrounding biodiversity and marine environment due to the presence of chemicals and the resultant salinity and temperature (Omersphahic et al., 2022). For instance, during freshwater production (95 million m3), brine (141.5 million m3), including toxins like chlorine and copper, is also produced. In addition, while typical saltwater is 3.5% sale, brine is 5% salt. Fish and insects can die if the water becomes too salty for them. Brine also lowers the O2 amount in the water around the desalination facilities, harming sea life (WEF, 2022). Therefore, the role and choice of water in clean H2 production is vital. For example, pink H2 was the most water-intensive due to its water consumption and withdrawal requirements, usually averaging 294 l/kg H2 and 9104 l/kg, considering once-through cooling, cooling ponds, and cooking towers (Mahijani & Hersbach, 2004). On a global basis, green H2 was considered the most water-efficient among all clean H2 types (Figure 16).
Since the freshwater supply would continue declining in the future, Japan could utilize wastewater with "untapped potential as a renewable-and arguably infinite-energy source" (Naylor & Gidda, 2022, p. 2). The Ministry of Environment established and revised effluent (liquid waste discharge) standards on October 21, 2015 (Nagoya University, 2020). According to Australian experts, recycled water for green H2 production has the potential for cost advantages compared to desalinated water (AUD$5/KL-1) and freshwater (AUD$2.75/KL-1) with an estimated cost of ~ AUD$0.70KL-1 (UQ-MQ, 2024). Furthermore, from an economic standpoint, per WEF (2022) wastewater uses less power than desalination. For example, for every million gallons of freshwater, wastewater reuse utilizes 8,300 kWh, whereas desalination uses about 15,000 kWh.
Figure 16
Lastly, H2 peroxide, pure O2, and ozone possessed significant potential in wastewater treatment. For example, UQ-MQ (2024) shared that pure O2 could reinforce the efficiency of secondary waste treatment. At the same time, ozone and H2 peroxide might be used as potent oxidizing agents in tertiary water treatment. Therefore, the utilization of electrolysis by-products not only created additional sales and other spinoff markets for by-products for green and pink H2 production but, ultimately, enhanced the value of using the nexus-integrated policies and a partial CE approach in Japanese green and pink H2 investment considerations.
CAPEX, including capital expenditures for green and pink H2 hubs with WWTPs and the cost of electrolyzers represented the study’s second economic criterion. First, regarding hubs, the potential cost of Japanese green and pink H2 hubs was unknown. As a comparison, the total project cost for a clean H2 hub was between $800 million and $2.5 billion in the USA (DOE, 2024d). Rising raw material prices and interest rates were expected to raise construction costs, putting pressure on the timing of a Final Investment Decision (FID) for Japanese clean H2 hubs (Humber, 2024). Japan’s clean H2 subsidy program, described in more detail later in the analysis, offered financial support for developing new infrastructure. The current vision was to establish clean H2 hubs, building upon the industrial complexes with chemical plants, steel mills, and power plants (Terazawa, 2024). Furthermore, the government would support the development of shared infrastructure at potential clean H2 hubs (WEF, 2023). Infrastructure sharing fits well with the analysis methodology, especially, with the “share” stage of the technical cycle of the Ellen MacArthur Foundation (2024)’s circular economy system diagram (Figure 1).
These hubs could be developed as so-called greenfieldsgreenfield (building them from scratch) or as brownfields (transforming existing industrial clusters while using and adapting their existing infrastructure). A greenfield green or pink H2 hub would be built in a rural location with space and resources available to develop large-scale industrial clusters and capacities for electricity generation. A brownfield hub could include industrial clusters with easy access to large-scale renewable or nuclear energy (UNIDO, 2023).
Salvaging existing infrastructure was an important consideration for building both green and pink H2 hubs. Such salvaging fits well with the analysis methodology, especially, with the “reuse” and “remanufacturing” stages of the technical cycle of the CE system diagram of the Ellen MacArthur Foundation (2024) (Figure 1). Retrofitting existing assets might enable scaling up green/pink H2-ready infrastructure more quickly, but it would come with unique challenges (Krishnan et al., 2024). For example, in some cases in Japan, salvaging legacy infrastructure had lead time and cost advantages. Upgrading naphtha pipelines to accommodate clean H2 was cheaper than building a new transportation network. However, salvaging could take longer if new and old functional requirements differed. For instance, a West Japanese consortium (Kansai Electric, the NTT Group, Panasonic, and the JR Group) planned to install gas pipelines in the ducts along underground cabling systems and railway tracks to deliver imported H2 from the port of Himeji. Since the fusion of telecom cable lines and extremely flammable gas was uncommon, resetting the safety standards for these essential infrastructures could take years. The group had plans for commercialization in the 2030s (Watanabe, 2024a).
Moreover, some experts claimed that pink H2 hubs would have an advantage over other clean H2 hubs due to exploiting existing infrastructure. For instance, pink H2 integration might leverage the previous infrastructure investments and reduce the need to build new infrastructure (Fernandez-Arias et al., 2024). However, the IAEA (2024) warned that, despite its advantages, coupling pink H2 plants and nuclear reactors would be a complicated process. Lastly, influenced by the study’s methodology, the green and pink H2 hubs based on the partial CE approach would need to incorporate the CAPEX for connecting them to the existing WWTPs, upgrading the existing ones, or building new ones, which can deliver suitable purified water for the green and pink H2 production.
Lastly, the cost of electrolyzers was the study’s second CAPEX economic criterion. FTI (2024) shared that the capital component of electrolyzers was usually the second most significant part of the LCOH for both green and pink H2. These types of clean H2 could become more competitive as the energy efficiency of electrolyzers efficiency (a 10 % increase in electrical efficiency could produce an 8.5% reduction in production costs) (Gaster, 2024). Three main electrolyte systems were used for water electrolysis operating under various conditions using different materials: alkaline water electrolysis (AWE), proton exchange membrane (PEM), and solid oxide electrolyzers (SOEC) for high-temperature electrolysis (IAEA, 2024; Nnabuife et al., 2023). According to IEA (2024a), alkaline electrolyzers continued to make the largest share, accounting for more than 60% of the installed electrolyzer capacity in 2023, PEM with 22%, and SOEC with 6%. Another electrolyzer technology that might reach 10% by 2030 was anion exchange membrane (AEM). Per Enapter (2024), unlike in a traditional AWE electrolyzer, an AEM electrolyzer allows O2 and H2 to be produced under pressures of 1 bar and 35 bar, respectively. The pressure difference between half-cells could prevent the produced O2 from crossing over to the other high-pressure half-cell, therefore ensuring that H2 has a very high purity of nearly 99%. Hydrogen Council (2024) announced 375 GW of electrolysis deployment through 2030. However, significant acceleration was required to grow from the current 2 GW to realize the full deployment.
Japan must also speed up the deployment of its electrolysis equipment. Although Japan had been seen as a world leader in fuel cell implementation, the country lagged far behind China and Europe in the development and commercialization of electrolyzers (REI, 2023). For example, in 2021, Japanese 2030 targets for 2030 for alkaline electrolyzers (52,000 yen/kW - 433 US$/kW) and PEM electrolyzers (65,000 yen/kW – 542 US$/kW), whereas Chinese cost for electrolyzers was 200-205 US$/kW (REI, 2022). In the last few years since REI (2022)’s analysis, the cost of an installed water electrolyzer increased significantly due to inflation affecting labor costs, materials, and higher interest rates. In 2023, the capital cost ranged between 2000 US$/kW for alkaline and US$2450 for PEM electrolyzers. Chinese alkaline electrolyzers were cheaper in terms of CAPEX and reached US$750/kW-US$ 1300/kW per system. According to IEA (2024)’s projections, based on capacity increases envisioned by announced projects, economies of scale, and mass manufacturing, the capital cost of an installed electrolyzer system could decrease by 40-50% by 2030 and up to 55% if projects at an early stage of development were also considered. Furthermore, the “Other Criteria” sub-section, focused on the “Impact on Environment” discusses the potential recycling of electrolyzers. This recycling fits well with the analysis methodology, especially with the “recycling” stage of the Ellen MacArthur Foundation (2024)’s CE system diagram (Figure 1).
A clean H2 subsidy was the study’s third economic criterion. Switching from fossil fuels to clean H2 and its derivatives would be costly for off-takers without initial financial support. Therefore, Japan’s H2 Promotion Act (HPA), which came into effect on October 23, 2024, could help overcome cost and infrastructure impediments for Japanese green and pink H2 market creation. The HPA would apply only to low-carbon H2 with a carbon intensity of 3.4 kg CO2/kgH2 or lower. The act had a broad scope and was color agnostic, including domestic/imported clean H2 and derivatives. It also focused on two objectives: 1) provision of support to approved businesses through a Contract for Difference (CfD) scheme, which covered the cost gap between clean H2/ derivatives and fossil fuels, and 2) support for developing clean H2 hubs. 15-year extended subsidies could only apply to domestic production or imports that would begin clean H2/derivatives supply before or in 2030. Although the subsidies would cover the project’s cost gap for 15 years, the projects must be self-sufficient for another 10 years after the subsidies end. Also, the projects had to be compatible with Japan’s GX policy and “S+3 E” energy policy, which focused on safety, energy security, environment, and economic efficiency. Clean H2 hubs, supplying more than 1,000 tons of clean H2 and its derivatives, would be considered as meeting the S+3E energy security objective. Lastly, 3 trillion yen (20 billion dollars) were pledged for support. Some experts expressed skepticism since this amount might barely cover 0.5 million tons of annual clean H2 equivalent supply. However, the government believed the amount was ample to inject into regions that want to position themselves as clean H2 hubs (Bocobza et al.; Terazawa, Humber, 2024; Davies et al., 2023).
Japan is a unique island nation with a remarkable track record of confronting and transcending adversity. Today, the country faces significant energy and environmental challenges, yet it also possesses the innovation, resilience, and ambition to rise to the occasion. By building a circular economy around hydrogen, Japan can ensure a sustainable and resilient energy future. Pink hydrogen, produced based on a partial circular economy approach, offers the most reasonable, practical, and economic clean hydrogen solution for Japan beyond 2040. While the clean hydrogen sector is still navigating its path, the future lies in focusing capital, talent, and time on practical, sustainable solutions that match Japan’s unique energy and environmental context. Japan’s hydrogen economy will thrive if it emphasizes precision over hype.
For further details, you can find the list of references and appendix here.
illuminem Voices is a democratic space presenting the thoughts and opinions of leading Sustainability & Energy writers, their opinions do not necessarily represent those of illuminem.
Philip Hosken

Green Hydrogen · Hydrogen
Venera N. Anderson

Green Hydrogen · Hydrogen
illuminem briefings

Green Hydrogen · Hydrogen
Hydrogen Insight

Green Hydrogen · Hydrogen
National Observer

Green Hydrogen · Hydrogen
Interesting Engineering

Green Hydrogen · Hydrogen